The Grib Manager
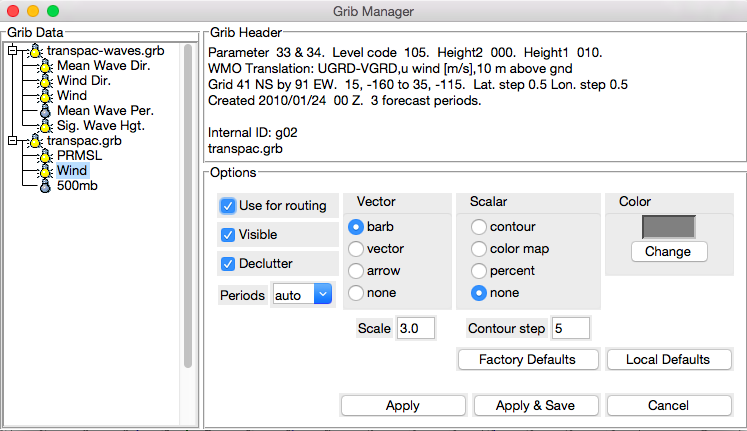
The Grib Manager window (Tools→Grib Manager) allows you to load GriB files into BLUEWATER, to examine Grib header data, and to modify various options for the imported GriB sequences. GriB data is displayed on the chart in one of several formats. Scalar data, such as pressure or wind speeds, can be displayed as contour lines or a color map. Vector data, such as wind velocity, can be displayed as a scaled arrow or a wind barb.
Clicking on the lightbulb next to a Grib sequence is a shortcut for turning on or off display of the grib i=data in the main window. Once you have selected a display style for a weather parameter such as Wind or PRMSL, you can save that display style for the next time.
The data can be “decluttered”. This is primarily useful for vector data such as winds. Decluttering reduces the number of wind barbs or arrows that are displayed in the window. Decluttering also makes the program faster. Decluttering is selected by default for wind data. For scalar data such as pressure, it is not used by default, since contour lines are not usually clutter-y.
By default, a wind sequence is usable in the computation of sailing times and optimum routes. To make it unusable for such purposes, uncheck the "routable" box. Even if a wind data set is decluttered for display purposes, the full data set is used for performance computations.
The selection of forecast period to display can be controlled through the “periods” drop-down box. If auto is selected, then the period to be displayed is determined by the value in the toolbar “Grib Periods” box. As that value is cycled, the displayed period changes accordingly. If number h is selected, then the forecast for hour h is shown, regardless of the value in the Grib Periods box. (This is the forecast for h hours after the sequence’s reference date and time, i.e., the time the forecast was created.) The “forecast” at hour zero (if it exists) is not a forecast at all -- it is the actual observed data used to generate the forecast.
If you know TCL and/or feel brave, you can adjust advanced display aspects for various parameter types by messing with the file "gribDescriptions.tcl" in the installation directory. The file contains some basic documentation. Save a copy first!