Back Sensitivity Analysis Next
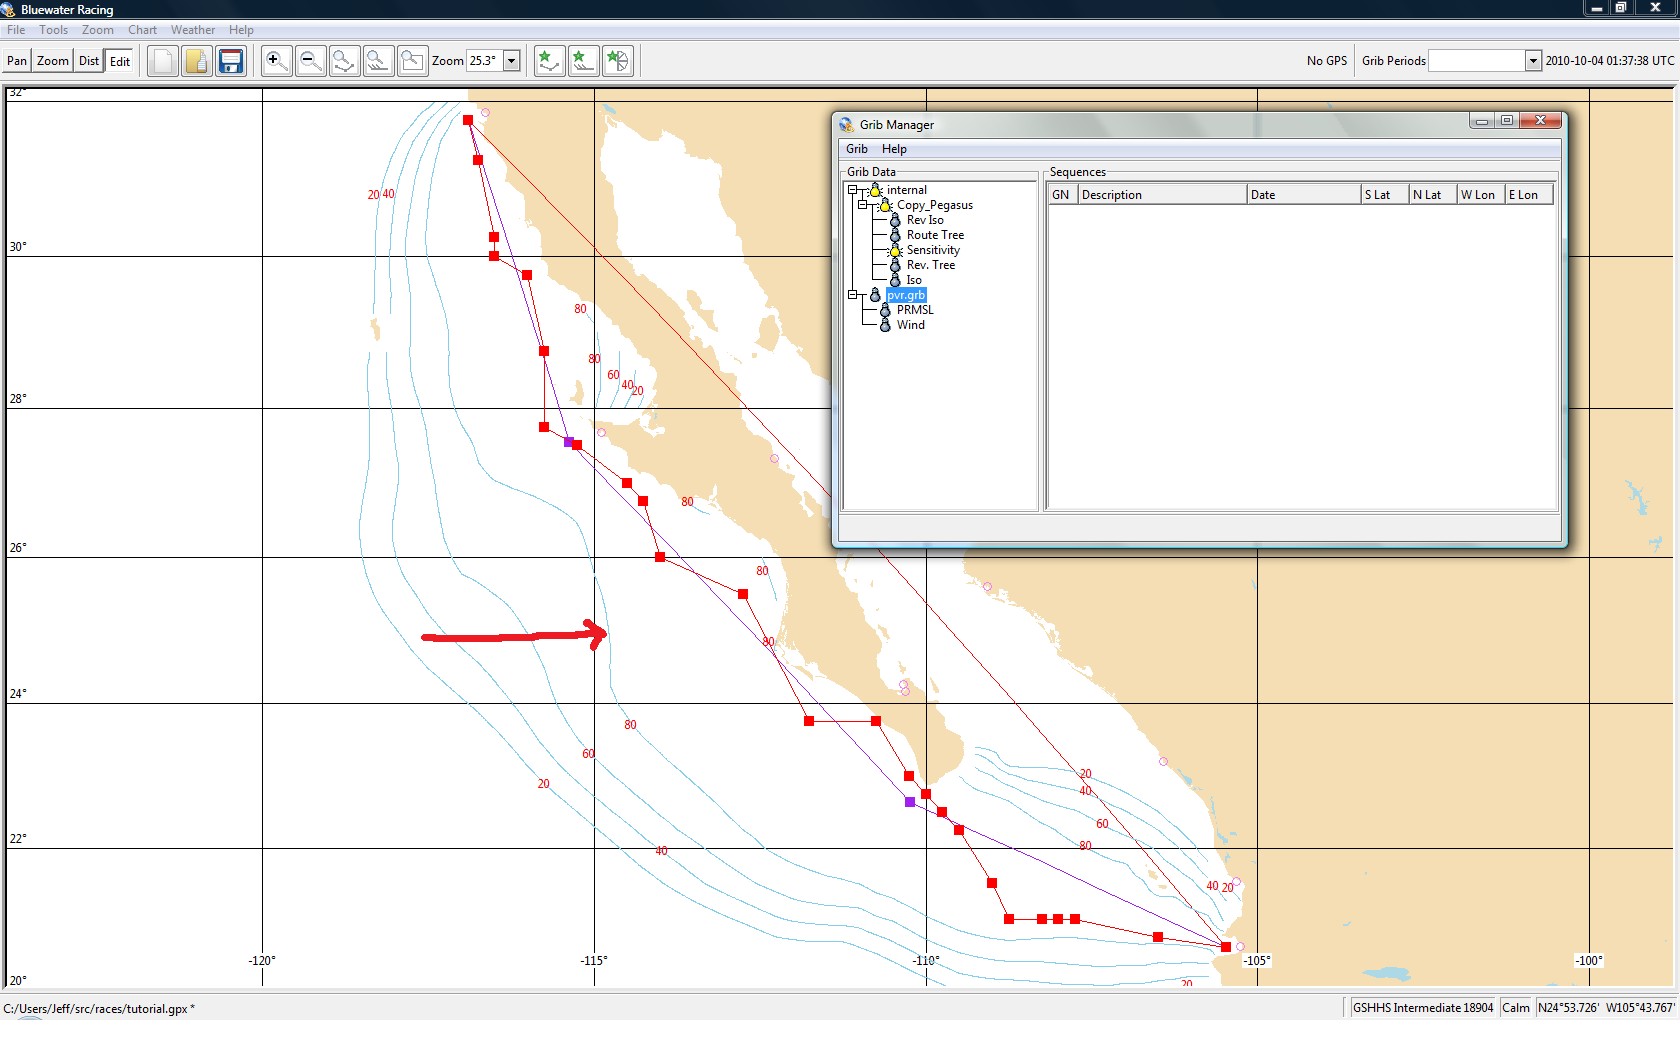
Use the Grib Manager to hide the wind and pressure data, and show the "Sensitivity" by clicking on lightbulbs. Sensitivity Analysis is an internal grib generated by the optimizer. The contours help show how sensitive the best route is to small changes in routing or weather. For example, the 80% contour defines an area within which you can sail and, with probability 80%, still finish close to the best finishing time.